
The Vintage Blend: What a Sector Valuation Median's "As Of" Date Doesn't Tell You
A sector median forward P/E stamped "as of today" is often built from peer observations taken days or weeks apart, and the timestamp rarely discloses that spread.
The Vintage Blend: What a Sector Valuation Median's "As Of" Date Doesn't Tell You
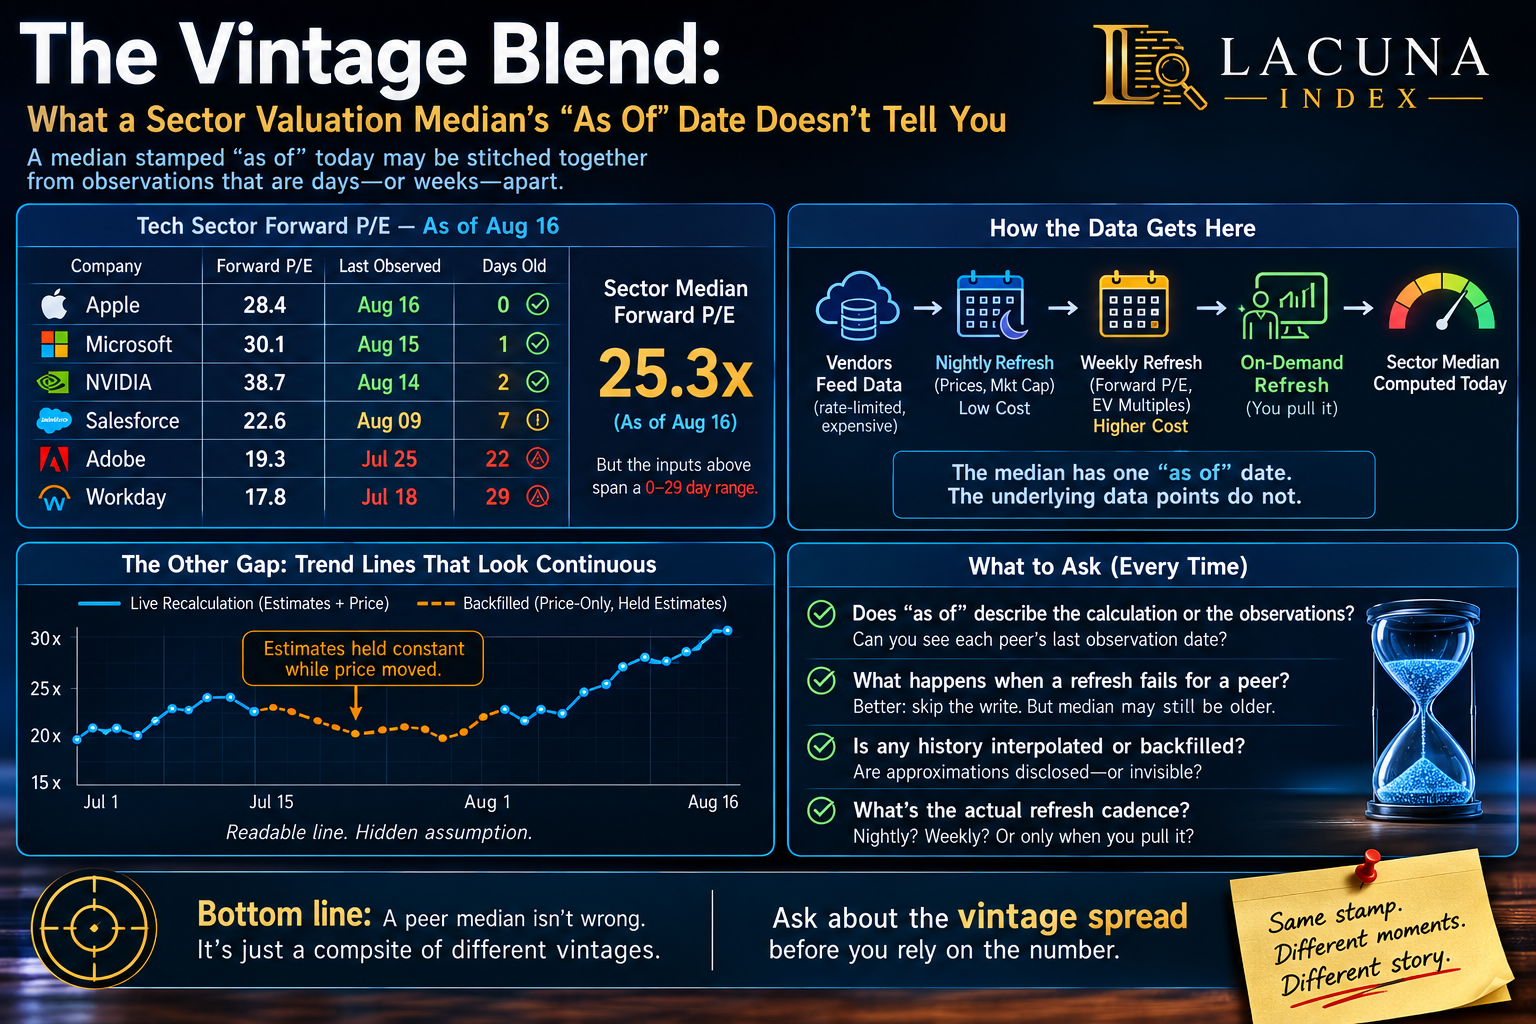
A dashboard shows you a sector's median forward price-to-earnings ratio (the stock price divided by analysts' consensus estimate of next year's earnings per share), stamped "as of August 16." It reads like a single, coherent snapshot — as if every company in that sector was priced on the same afternoon and the median was pulled from that one moment. Usually it wasn't. The date stamp tells you when the number was computed. It doesn't tell you when each company that fed into it was last observed — and those two dates can be weeks apart for some of the peers sitting inside the same median.
This isn't a hypothetical. It's how most cross-sectional benchmarking pipelines actually work, including LacunaIndex's own, and walking through the mechanism is a useful way to see exactly where the gap opens up.
Why the blend happens
A sector median forward P/E needs a forward P/E for every peer in the group. Getting a fresh one for every peer, every time, from a market-data vendor is expensive and rate-limited, so most systems — LacunaIndex included — run refreshes on different cadences depending on cost and urgency: a cheap nightly pass that only updates price and market cap, a heavier weekly pass that recomputes forward P/E and enterprise-value multiples for the full roster, and an on-demand pass triggered when someone actually pulls up a specific company or peer cohort, which re-fetches the whole peer set fresh in that moment.
Those three cadences coexist by design — the nightly job would be too expensive to run at full depth, and the on-demand path would be too slow to run for the entire coverage universe every night. But it means that on any given day, some peers in a sector have hours-old valuation data and others have last week's, or last month's, because a data-vendor call failed for that one company on the day it was supposed to refresh. The system's own write step is disciplined about this at the level of a single company — when a valuation refresh comes back empty for a ticker, it does not silently reuse an old number and pretend it's new; it declines to write a row for that company on that day and tries again next cycle. That's the right behavior for an individual data point. It does not, however, stop the median from being built out of whatever the freshest available value happens to be for each peer — which, by construction, pulls together observations from different dates and reports the result under a single "as of" timestamp for the day the median itself was calculated.
A second layer: the trend line isn't always a live recalculation
The same gap shows up, in a more subtle form, in valuation-spread history charts — the line showing how a company's premium or discount to its sector has moved over time. When there's a multi-day gap in a company's snapshot history (a vendor outage, a rate limit, a ticker that simply hadn't been touched in a while), the pipeline fills the missing days rather than leaving a flat jump in the chart. It does this by holding the forward earnings estimate constant at its current value and varying only the daily closing price across the gap. That produces a clean, readable line — but for the backfilled stretch, the multiple's movement reflects price action alone, not any change in what analysts expected the company to earn. The system tags these rows differently in its own internal notes from a genuine same-day snapshot, so the distinction is traceable if you go looking for it in the underlying data. It is not, however, visible in the chart itself. A reader sees one continuous curve; only some of it is a real day-by-day recalculation, and some of it is a price-only approximation standing in for missing history.
What to actually check
None of this means the numbers are wrong, and none of it is specific to LacunaIndex — it's an inherent property of any benchmark built by aggregating many independently-refreshed time series into one cross-sectional snapshot. But it means the headline "as of" date on a peer median is answering a narrower question than it appears to: it's telling you when the aggregation ran, not when the inputs were taken. For a diligence analyst leaning on a peer-relative valuation claim, four questions are worth asking of any data source, LacunaIndex or otherwise, before treating a median as a same-moment comparison:
- Does the "as of" date describe the calculation or the underlying observations? If it's the former, ask whether the provider can show you the observation date for each individual peer.
- How does the system handle a peer whose refresh failed that cycle? The safer answer is that it skips writing a fresh value rather than silently repeating a stale one under a new timestamp — but even the safer answer still leaves that peer's contribution to the median older than the rest.
- Is any part of a historical trend line interpolated or backfilled, and does the source disclose which stretches are approximations versus live recalculations? A held-constant input (an earnings estimate, a multiple, a discount rate) dressed up as a continuous series will understate how much genuinely changed.
- What's the actual refresh cadence behind the number you're looking at — nightly, weekly, or pulled fresh at the moment you asked for it? A number refreshed on-demand when you opened the page carries a different reliability than one sitting from the last scheduled batch job.
A peer median that discloses its sample size but not its vintage spread is still only half-verified. Ask the second question as routinely as the first.