
Why a Restructuring Biotech Gets No Credit for Its Story: How Lifecycle Stage and Capital Intensity Reweight the Same Six Pillars
A single composite score hides how much each dimension counted, so this post shows the published weighting arithmetic, with worked examples, so an analyst can see why two issuers with similar sub-scores land in different places.
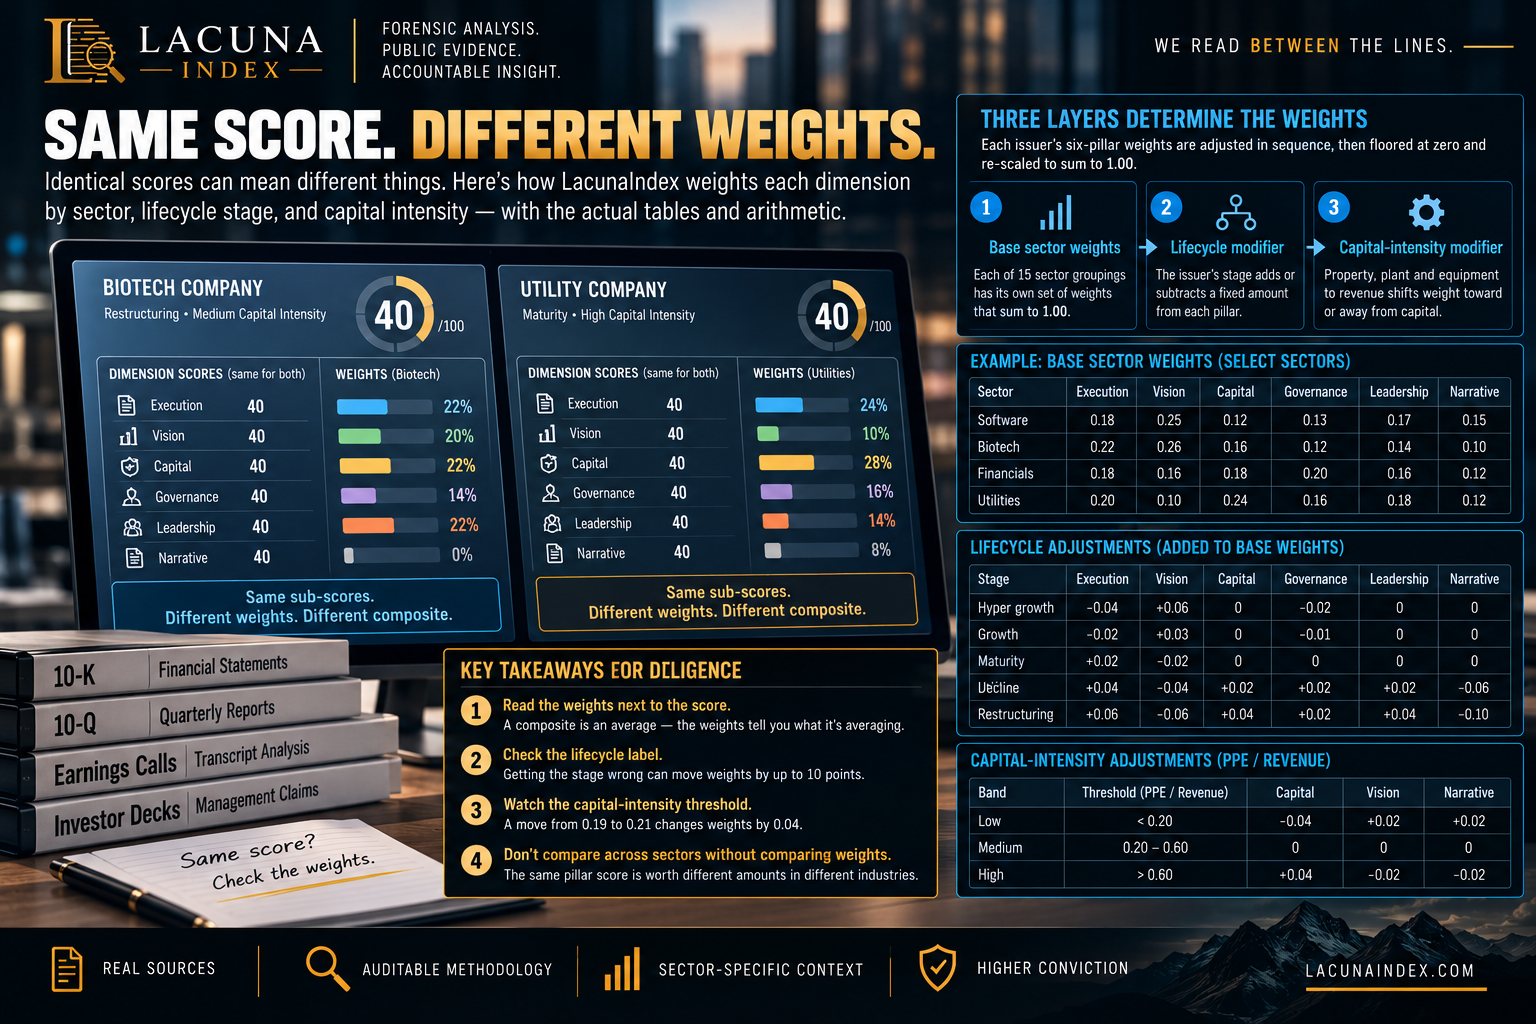
When two issuers carry the same composite score, an analyst's first instinct is to treat them as equivalent. That instinct skips a question that matters in diligence: how much did each dimension count toward the number? A biotech and a utility can post identical sub-scores on all six dimensions and still end up with different composites, because the dimensions were never weighted equally to begin with.
This post walks through how LacunaIndex sets those weights, using the actual tables and the actual arithmetic, so you can reproduce any weighting by hand.
Six pillars, three layers of adjustment
Every composite is built from six pillars: execution, vision, capital, governance, leadership and narrative. The weight each pillar receives is resolved in three steps, in this order:
- Base sector weights. Each of 15 sector groupings (software, semiconductors, internet platform, financials, insurance, industrials, energy, materials, consumer staples, consumer discretionary, healthcare, biotech, real estate, utilities and telecom) has its own row of six weights that sum to exactly 1.00.
- Lifecycle modifier. The issuer's stage (hyper growth, growth, maturity, decline or restructuring) adds or subtracts a fixed amount from each pillar.
- Capital-intensity modifier. The ratio of property, plant and equipment to revenue places the issuer in a low, medium or high band, which shifts weight toward or away from the capital pillar.
The result is then floored at zero for any pillar that went negative, and re-scaled so the six weights sum to 1.00 again. The tables are versioned (currently 2.1.0) and are described as immutable once promoted: changing a value requires a new versioned file, not an edit, so a historical score can always be traced to the table that produced it.
What the base rows say about each sector
The base rows encode a view of what matters in each industry, and they differ visibly:
- Biotech puts 26% on vision and only 10% on narrative. Pipeline credibility matters; messaging polish does not.
- Energy and utilities put 24% on capital, the highest of any sector, and only 12% on vision for energy and 10% for utilities.
- Insurance and financials put 20% on governance, versus 12% for biotech and semiconductors.
- Software puts 25% on vision, because the thesis is largely about what the product becomes.
If you compare a software issuer's governance score to a bank's, the same raw number carries 13% of the composite in one case and 20% in the other.
The lifecycle layer: decline and restructuring penalise narrative
The lifecycle table is deliberately not balanced. Its own description notes that rows do not sum to zero by design, because the tilts in decline and restructuring are intentional. The adjustments are:
| Stage | Execution | Vision | Capital | Governance | Leadership | Narrative |
|---|---|---|---|---|---|---|
| Hyper growth | -0.04 | +0.06 | 0 | -0.02 | 0 | 0 |
| Growth | -0.02 | +0.03 | 0 | -0.01 | 0 | 0 |
| Maturity | +0.02 | -0.02 | 0 | 0 | 0 | 0 |
| Decline | +0.04 | -0.04 | +0.02 | +0.02 | +0.02 | -0.06 |
| Restructuring | +0.06 | -0.06 | +0.04 | +0.02 | +0.04 | -0.10 |
The pattern is consistent. A fast-growing issuer is judged more on vision and less on near-term execution. A mature one shifts slightly toward execution. A declining or restructuring issuer is judged more on delivery, capital, governance and leadership, and much less on the story it tells. Narrative loses 10 points of weight in a restructuring, which for many sectors is most of its base weight.
The capital-intensity layer
The band thresholds are set on property, plant and equipment divided by revenue:
- Below 0.20 is low: the capital pillar loses 0.04.
- From 0.20 up to and including 0.60 is medium: no change.
- Above 0.60 is high: the capital pillar gains 0.04.
The shift is not free. It is absorbed equally by vision and narrative, so a high-intensity issuer gains 0.04 on capital and loses 0.02 each on vision and narrative. A low-intensity issuer does the reverse. The logic is that a business with heavy fixed assets should be judged more on how it deploys capital and less on its forward story.
Worked example 1: the same software company at two stages
Take the software base row: execution 0.18, vision 0.25, capital 0.12, governance 0.13, leadership 0.17, narrative 0.15. Assume a low capital-intensity band, which is typical for software (capital -0.04, vision +0.02, narrative +0.02).
As a mature issuer: execution 0.20, vision 0.25, capital 0.08, governance 0.13, leadership 0.17, narrative 0.17. These sum to 1.00.
As a restructuring issuer: execution 0.24, vision 0.21, capital 0.12, governance 0.15, leadership 0.21, narrative 0.07. These also sum to 1.00.
Same sector, same capital profile. Narrative falls from 17% of the composite to 7%, and execution and leadership together rise from 37% to 45%. If the restructuring company's management is excellent at telling the story and mediocre at delivering it, the composite will be lower than it would have been under the mature weights, and that is the intended behaviour.
Worked example 2: where the floor and re-scaling matter
Biotech starts with narrative at 0.10. In a restructuring, narrative takes a -0.10 adjustment, which lands it at exactly zero. With a medium capital band, the weights are execution 0.22, vision 0.20, capital 0.22, governance 0.14, leadership 0.22 and narrative 0.00, summing to 1.00. Narrative contributes nothing to the composite.
Now make the same company high capital-intensity. Capital gains 0.04, and vision and narrative each lose 0.02. Narrative goes to -0.02, which is floored at zero, and vision falls to 0.18. The remaining weights now sum to 1.02, so every pillar is divided by 1.02: execution about 0.216, vision about 0.176, capital about 0.255, governance about 0.137, leadership about 0.216 and narrative 0.
This is the reason the final step exists. Without the floor, a negative weight would reward a company for a worse narrative score. Without re-scaling, the composite would drift off its 0-to-100 scale.
What this means for a diligence workflow
Read the weights next to the score. A composite is an average, and the weights tell you what it is an average of. When two peers differ by a few points, check whether the gap comes from the pillar scores or from the weights being different.
Ask whether the lifecycle label is right. The label is an input, and the effect of getting it wrong is large. A company tagged as maturity instead of restructuring keeps up to 10 points of narrative weight it arguably should not have. If you disagree with the stage, you disagree with the composite.
Check the capital-intensity band near the thresholds. An issuer with property, plant and equipment at 0.19 of revenue is in the low band, and one at 0.21 is in the medium band. The weights move by 0.04 across that line, so borderline cases deserve a second look.
Do not compare composites across sectors without comparing weights. The same pillar score is worth different amounts in different sectors. That is a feature, since a bank and a chip designer are not judged on the same things, but it makes cross-sector composite rankings weaker evidence than same-sector ones.
Limits worth stating
The weights are fixed tables, not fitted to returns, and they encode a judgement about what matters by sector and stage. They are one input to a diligence view, not a forecast. The lifecycle stage and capital band are classifications that feed the tables, and the tables will give a precise-looking answer even when the classification is arguable. Treat the weighting as a transparent assumption you can challenge, which is the reason it is published as a versioned table and not buried in a model.